Live Chart Example
SteelyTrendChannel In Action
Real chart screenshot showing the indicator in a live NinjaTrader 8 session.
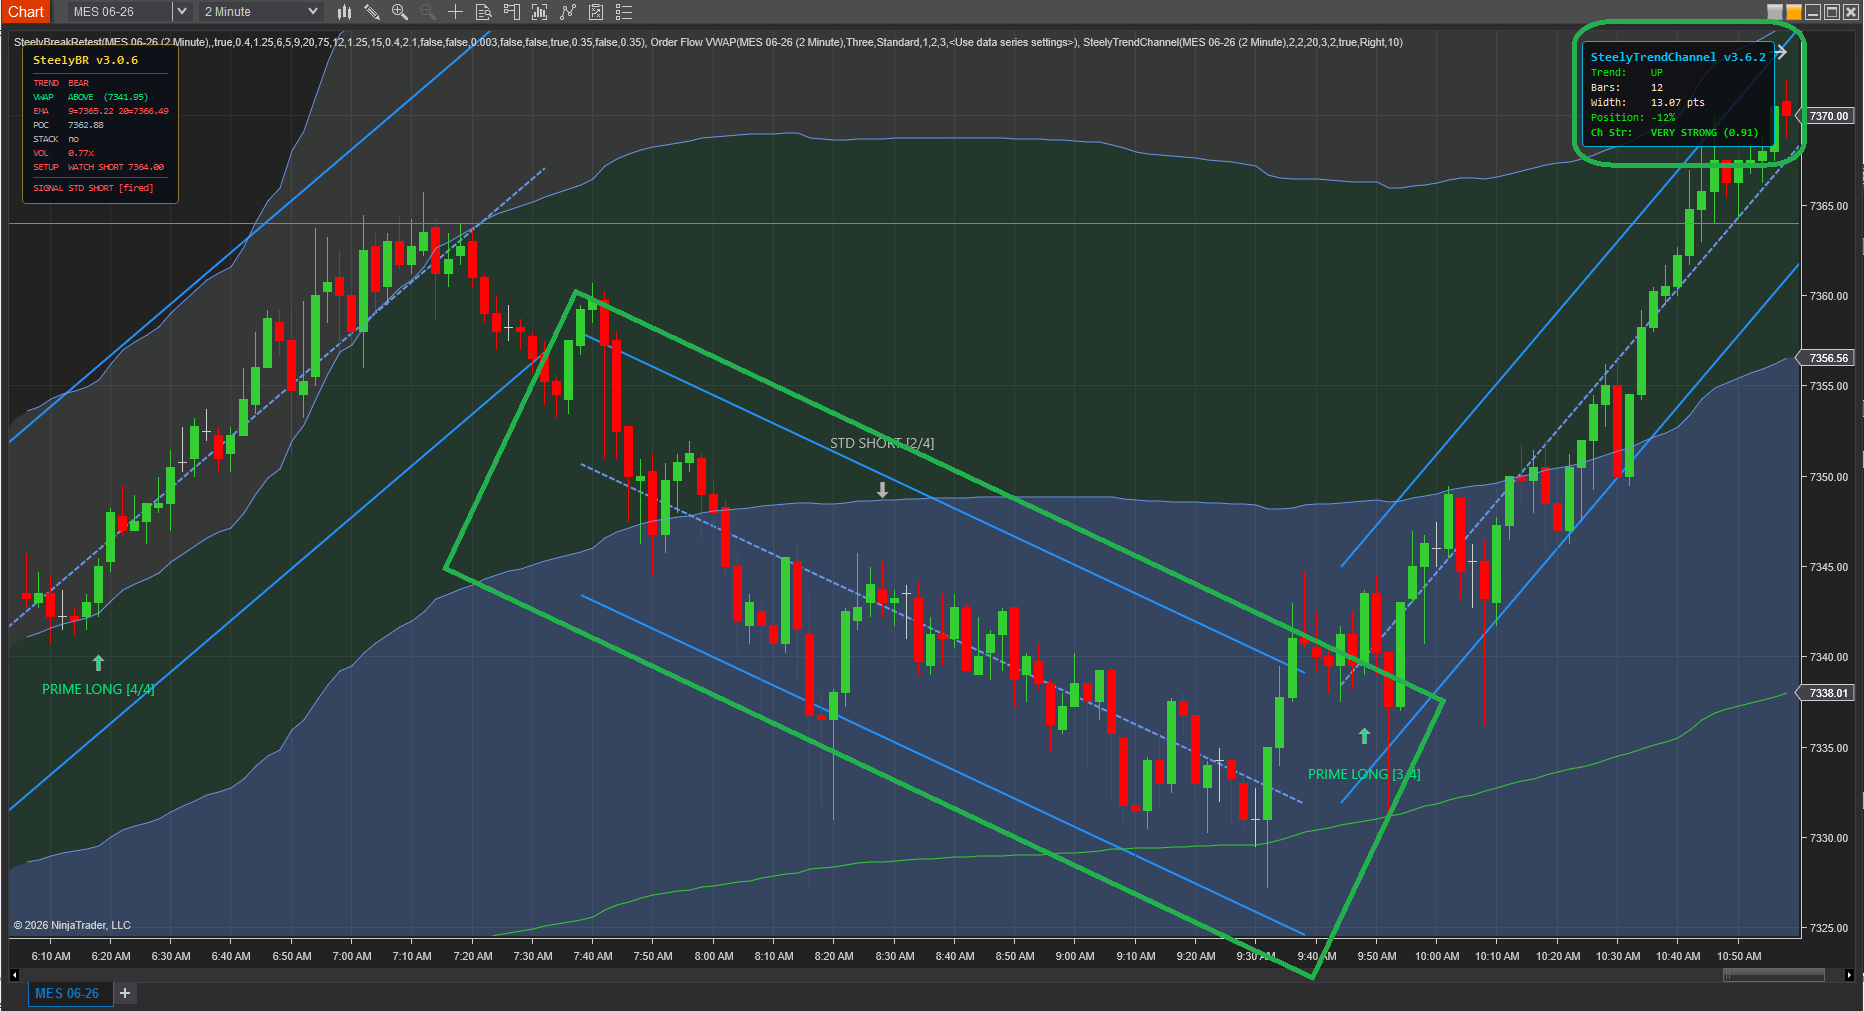
Watches price for short trend segments, fits a regression channel to each with standard-deviation envelope bands, and locks it the moment a breakout confirms — then immediately starts building the next. A running map of how the trend has actually behaved, drawn in real time, with no hand-drawn trendlines and nothing to redraw when the move shifts.
Real chart screenshot showing the indicator in a live NinjaTrader 8 session.
A trendline drawn twenty bars ago describes a market that no longer exists. SteelyTrendChannel keeps the structure current without a single manual redraw.
A line you drew by hand, already obsolete the moment price broke it.
Redrawing is slow, so you keep trading against structure that no longer fits the move.
Adds a second opinion that competes with your signal tool for the decision.
The channel you'd draw by hand — drawn continuously, and never stale.
A trendline is obsolete the moment price breaks it — but it's still on your chart, because redrawing by hand is slow when you're busy trading. SteelyTrendChannel removes the lag entirely.
It detects each trend segment, channels it, and when price breaks out it doesn't argue with the move — it locks the old channel and builds a fresh one around the new behavior.
The chart always shows the trend as it is, not as it was twenty bars ago. It draws structure rather than firing signals — built to sit underneath whatever signal tool you already trade.
Important Notice: This indicator is a non-customized charting tool provided for educational and informational market analysis only. It draws visual context and does not generate signals, constitute financial advice or trading recommendations, or solicit the purchase or sale of any instrument. Users remain solely responsible for whether, when, and how they trade. Past performance of any analytical method is not indicative of future results.
A pure visual-context tool, built to sit underneath whatever signal indicator you trade and answer the question those tools don't: what is the trend structure right now?
Layer it beneath an ORB, divergence, or break-and-retest tool to see whether a signal is firing with the channel or against a just-broken one.
Locked channels stack as a visual history, so the sequence of trend shifts across the session is readable at a glance.
The standard-deviation bands frame each segment's typical range, giving immediate context for how far price has stretched within the current channel.
SteelyTrendChannel fits a regression channel to each trend segment, locks it on breakout, and rebuilds the next — a live, side-by-side map of how the trend has actually behaved. The channel you'd draw by hand, drawn continuously and never stale.